Social media is an indispensable tool for businesses to connect with their audience and promote their brand. The average internet user spends 2.5 hours a day on these sites, so using social media to market your business is a no-brainer. But since these users have an average of 7.2 unique social media accounts, it can be a challenge for brands to ensure they’re tracking the engagement metrics they should focus on.
Services like ad retargeting presents a unique opportunity to promote your products to social media users who have already shown an interest. 77% of both B2B and B2C marketers use retargeting as part of their social media strategy.
Read on for everything you need to know to track engagement across each social media platform!
What are social media engagement metrics?
If you’re running an online business, you know that social media is essential for building your brand and reaching your target audience.
But how do you know if your social media strategy is working? That’s where social media engagement metrics come in.
Engagement metrics such as likes, comments, shares, and clicks are measurable data points that tell you how well your content resonates with your audience. These metrics divided by your total audience form your engagement rate, which is the best way to measure the success of your content.
Having a strong engagement rate not only increases your reach, leading to more exposure for your brand, but it also helps build an audience of loyal customers.
By tracking these metrics, you can gain valuable insights into what’s working and what’s not, so you can adjust your strategy accordingly.
How to find social media engagement metrics
If you’re wondering how to find your social media engagement metrics, don’t worry — it’s easier than you might think! All you need to do is locate the analytics section of each platform.

Most social media platforms have built-in analytics that provide valuable insights into how your audience interacts with your content.
However, some platforms like Instagram and TikTok require you to switch to a business or creator account to access their analytics features.
Engagement metrics on Facebook
Facebook has been one of the largest social media platforms for a long time, and is a preferred place to advertise for many businesses. Despite its large user base, the median engagement rate for Facebook is only 0.064%, which may seem low.
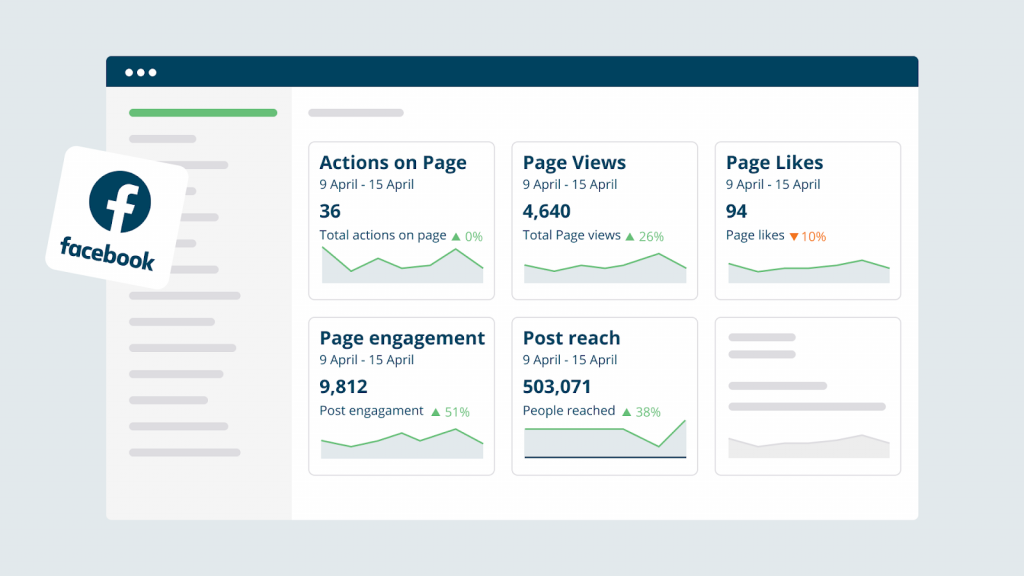
- Likes and reactions: Likes and reactions are a simple way for users to show their appreciation for your content. When a user clicks the “Like” button or uses one of Facebook’s reaction emojis, it signals to the algorithm that the content is resonating with your audience.
- Comments: Comments are a way for users to engage with your content directly and start a conversation. When a user leaves a comment, it can signal to the algorithm that the content is generating discussion and engagement.
- Shares: A user sharing your content can help you reach a wider audience. The algorithm favors shares more as they’re considered an active form of engagement.
- Click-through rates: CTR measures the percentage of users who click on a link in your post compared to the number of people who saw it. This metric is essential for measuring the effectiveness of your calls-to-action and the overall engagement of your audience.
Facebook’s algorithm rewards content that generates high engagement, so focusing on these metrics can help increase the reach of your content and grow your audience.
Engagement metrics on Instagram
Instagram offers multiple ways to share content, including photos and videos on feeds, Instagram Reels, and Stories. In recent years, the company has been focusing on Reels as a competitor to TikTok.
With over 1 billion Reels shared through direct messages daily, it’s clear that Reels has quickly become a popular way for users to create and share short-form video content.
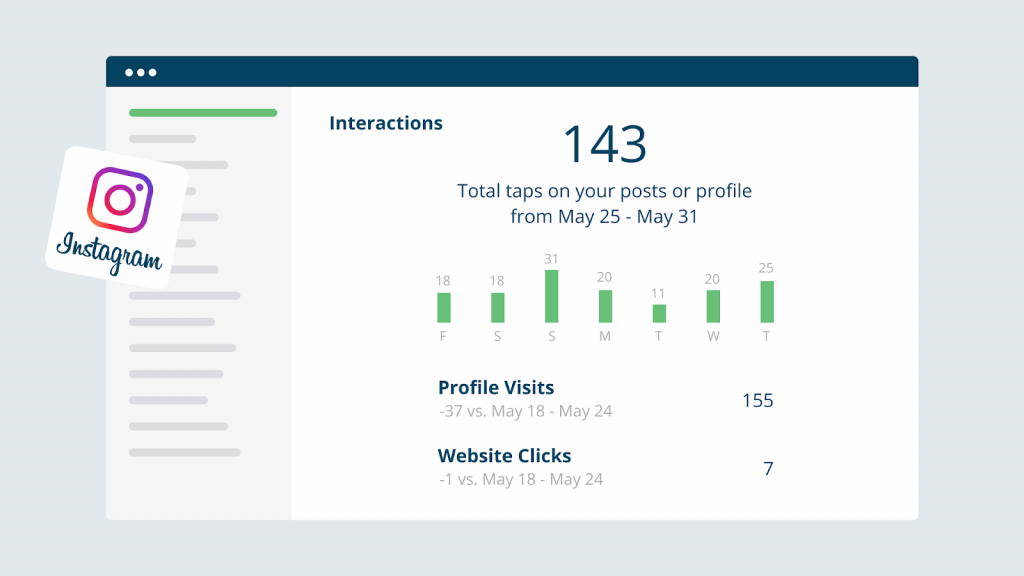
- Impressions: Impressions are the number of times your post has been seen. This metric counts each time your post appears on someone’s screen, regardless of whether they engage with it. Impressions are tracked across a user’s feed, your profile page, hashtag pages, and the explore page.
- Likes and comments: Likes and comments are two of Instagram’s most visible forms of engagement. They indicate that someone took the time to engage with your content and express their opinion. Likes can also help boost your post’s visibility in the algorithm, as Instagram favors content that generates high engagement.
- Shares and saves: Shares and saves are worth their weight in gold as forms of engagement because they help amplify your content beyond your existing followers. When someone shares your post with their followers, it exposes your content to a new audience.
- Profile visits: Profile visits are the number of times someone clicks on your profile from your post. This metric can give you insights into how many people are interested in learning more about your brand after seeing your content.
- Instagram Stories engagement: Instagram Stories offer a variety of engagement metrics, including views, replies, and swipe-ups. Views are the number of people who viewed your Story, replies are the number of people who sent you a direct message in response to your Story, and swipe-ups are the number of people who swiped up on your Story to access additional content.
Check out our article on Instagram story ideas to learn more about creating engaging Instagram Stories.
Engagement metrics on YouTube
YouTube, the world’s largest video sharing platform, offers a range of engagement metrics that can help content creators and businesses measure their success on the platform.
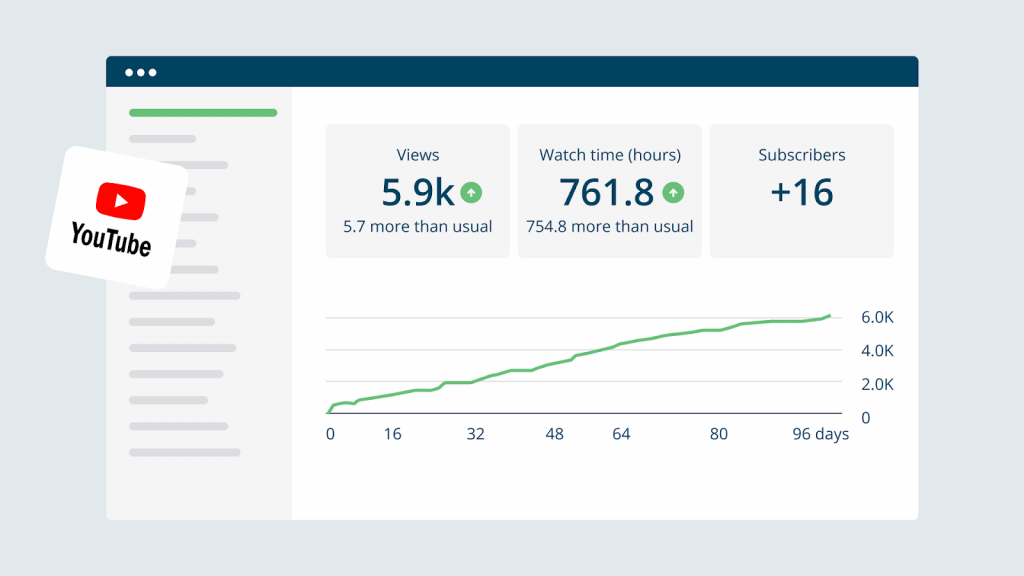
- Views and watch time: Views refer to the number of times your video has been watched, while watch time measures the amount of time users spend watching your video. This metric is important because it can affect your video’s visibility in search results and recommendations.
- Likes and comments: Likes and comments are a key measure of user engagement on YouTube. Users can indicate their appreciation for a video by liking it, and comments allow users to interact with the creator and other viewers.
- Subscriber count: Subscribers are users who have chosen to follow your channel and receive notifications when you upload new content. It’s a good idea to focus on something other than subscriber count, as any video has the potential to go viral.
- Click-through rates: CTR measures the number of clicks your video receives relative to the number of impressions (the number of times your video is shown).
- Impressions: Impressions measure the number of times your video thumbnail is shown to users on YouTube. Thumbnails show up in search, the homepage, and in suggested videos.
- Average view duration: This metric measures users’ average time spent watching your video. A high average view duration can indicate that your content is engaging and that users find value in it.
YouTube provides one of the most detailed and transparent analytics systems for social media. It’s worth looking through everything to see which of your videos are performing well or struggling to make a splash.
Engagement metrics on TikTok
TikTok has taken the social media world by storm, and it’s quickly becoming a powerful marketing tool for businesses of all sizes.
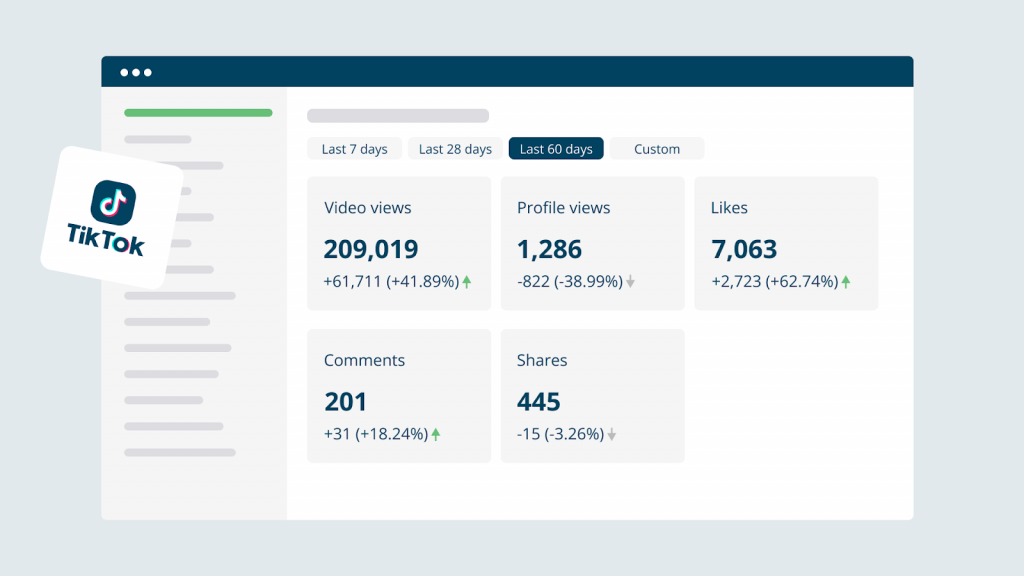
Here are the most important metrics to track on TikTok:
- Views and playtime: Views are the number of times your video has been watched, while playtime is the total time people have spent watching it.
- Likes, comments, shares, and saves: These four metrics are the main ways TikTok measures engagement. Likes show how many people enjoyed your video, and comments reveal how engaged your audience is. Shares demonstrate how much people want to spread your content. Saves indicate how valuable your content is to viewers.
- Follower count: As with other social media platforms, your follower count indicates your overall reach and influence. However, your follower count has little to do with the chance of going viral.
- Video completion rate: This metric shows how many people watched your entire video. It’s an important indicator of how engaging your content is and how likely people are to stick around for the full experience.
When it comes to TikTok, one important thing to keep in mind is that engagement rates are typically higher than on other platforms. In fact, the average engagement rate for a brand on TikTok is 5.8%, which is significantly higher than other platforms like Facebook.
Engagement metrics on LinkedIn
Like other social media platforms, LinkedIn also has its own set of engagement metrics to track the performance of your business page.
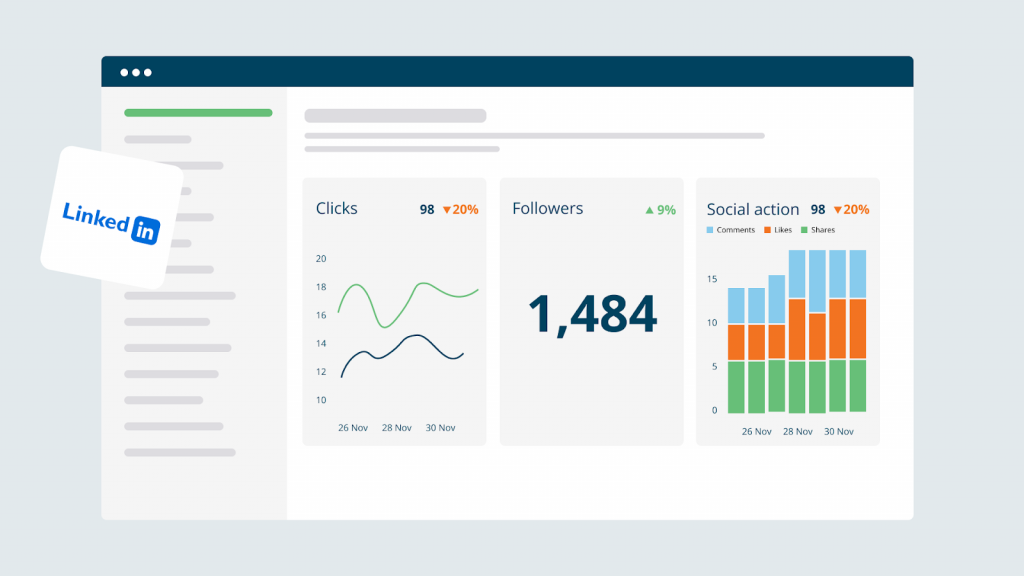
Here are the most important engagement metrics for LinkedIn:
- Likes and comments: These are the basic engagement metrics on LinkedIn, indicating that people are interested in and actively engaging with your content. By monitoring the number of likes and comments on your posts, you can gauge the engagement level of your audience and adjust your content strategy accordingly.
- Shares and saves: When someone shares or saves your post, it indicates that they found your content valuable enough to share with their network or save it for future reference. These engagement metrics are important because they can help expand your reach and bring in new followers.
- Click-through rates: A high CTR indicates that your content is relevant and engaging and people are interested in learning more. It’s an important metric to track because it can give you insights into the effectiveness of your content, especially if you’re using LinkedIn for lead generation.
- Follower count: By tracking your follower count over time, you can see how your page grows and adjust your content strategy to attract more followers.
Engagement metrics on Pinterest
Pinterest is a highly visual platform where users can create and share image collections or “boards” on various topics. To track the success of your Pinterest account, it’s important to watch engagement metrics.
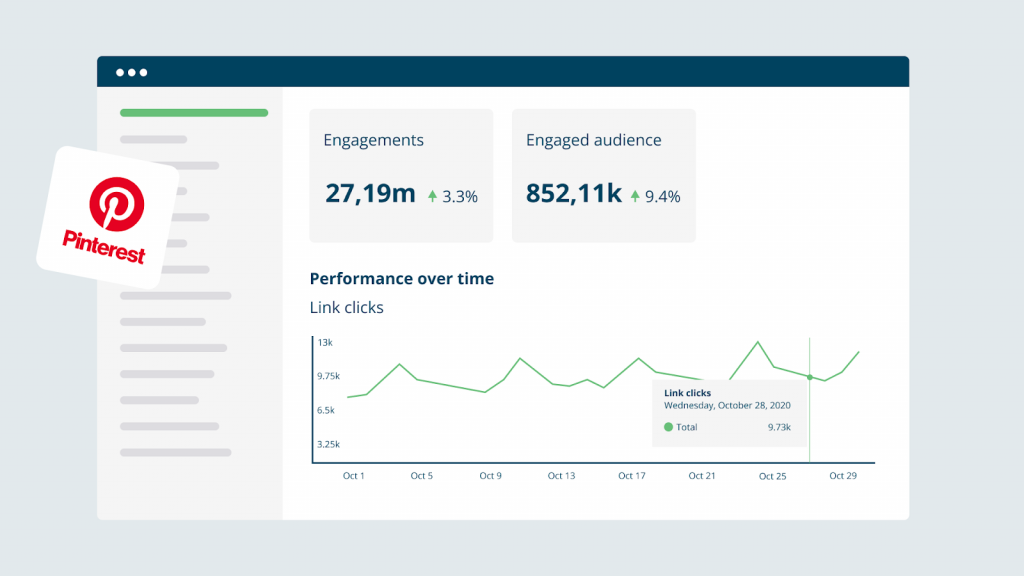
Here are some of the most important engagement metrics to track on Pinterest:
- Pins and repins: These are the basic engagement metrics on Pinterest, with a “pin” being an image or video that a user has saved to their board and a “repin” being when someone else shares that pin to their own board.
- Comments and likes: Users can also leave comments and likes on pins, which are indicators of engagement and can help increase the visibility of your content.
- Click-through rate: This metric shows how many people click through to your website or blog from your pins. You can see which pins drive the most traffic to your site by tracking your CTR.
- Follower count: Like other social media platforms, follower count is an important metric to track on Pinterest. A larger following can lead to more visibility and engagement.
- Impressions: Impressions refer to how often users have seen your pins on the platform. This metric can help you track the reach of your content and identify trends over time.
- Video views and time viewed: Pinterest also offers video content, so tracking video views and time viewed can help you understand how users engage with your video content.
By monitoring these engagement metrics, you can gain valuable insights into how users interact with your content on Pinterest and make data-driven decisions to improve your strategy.
Track engagement across channels using Loomly
Tracking engagement metrics across multiple social media channels can be time-consuming and overwhelming.
That’s where Loomly comes in.
With Loomly’s analytics feature, you can track engagement metrics across your social media accounts in one place. This allows you to see what’s working and what’s not, making it easier to refine your marketing strategy and improve your social media presence.
Loomly’s post builder also helps you create engaging content that resonates with your audience. You can use the platform to collaborate with your team, schedule posts in advance, and optimize your content for maximum engagement.
By using Loomly to schedule your posts, you can ensure that your content is shared at the optimal time for your audience, increasing the likelihood of engagement.
Conclusion
Tracking these engagement metrics on your social media platforms allows your business to measure the effectiveness of its social media efforts.
They provide a tangible way to evaluate the success of campaigns and adjust strategies as you learn more about your audience. In a landscape where social media algorithms are constantly evolving, keeping a close eye on engagement metrics is the only way to stay ahead of the competition.
So, if you haven’t already, start tracking your engagement metrics today and watch your social media strategy flourish. Don’t miss out on the opportunity to learn from your content’s performance and connect with your audience in more impactful ways!
